
Describe the purpose of the Home Page, Search Bar, Entity Page, Domains, and Glossary
Navigate to a specific dataset using the search bar
Identify an asset's owner, domain, schema, and upstream lineage from its entity page
Know where to look for each question: the tabs on an asset's page (Columns, Lineage, Quality) and the sidebar sections beside them (Owners, Domain, Tags)

The Home Page
You can customize the home page — but its day-to-day use is simple
Browse: the left sidebar takes you everywhere — Domains, Glossary, and the rest
Search: the search bar at the top, available on every page
The home page is a convenience, not a command center. Think of it as a Recently Opened panel: great for returning to something you were just working on, but the wrong tool for finding something new. Glance at announcements occasionally; admins post notices there, like upcoming deprecations.
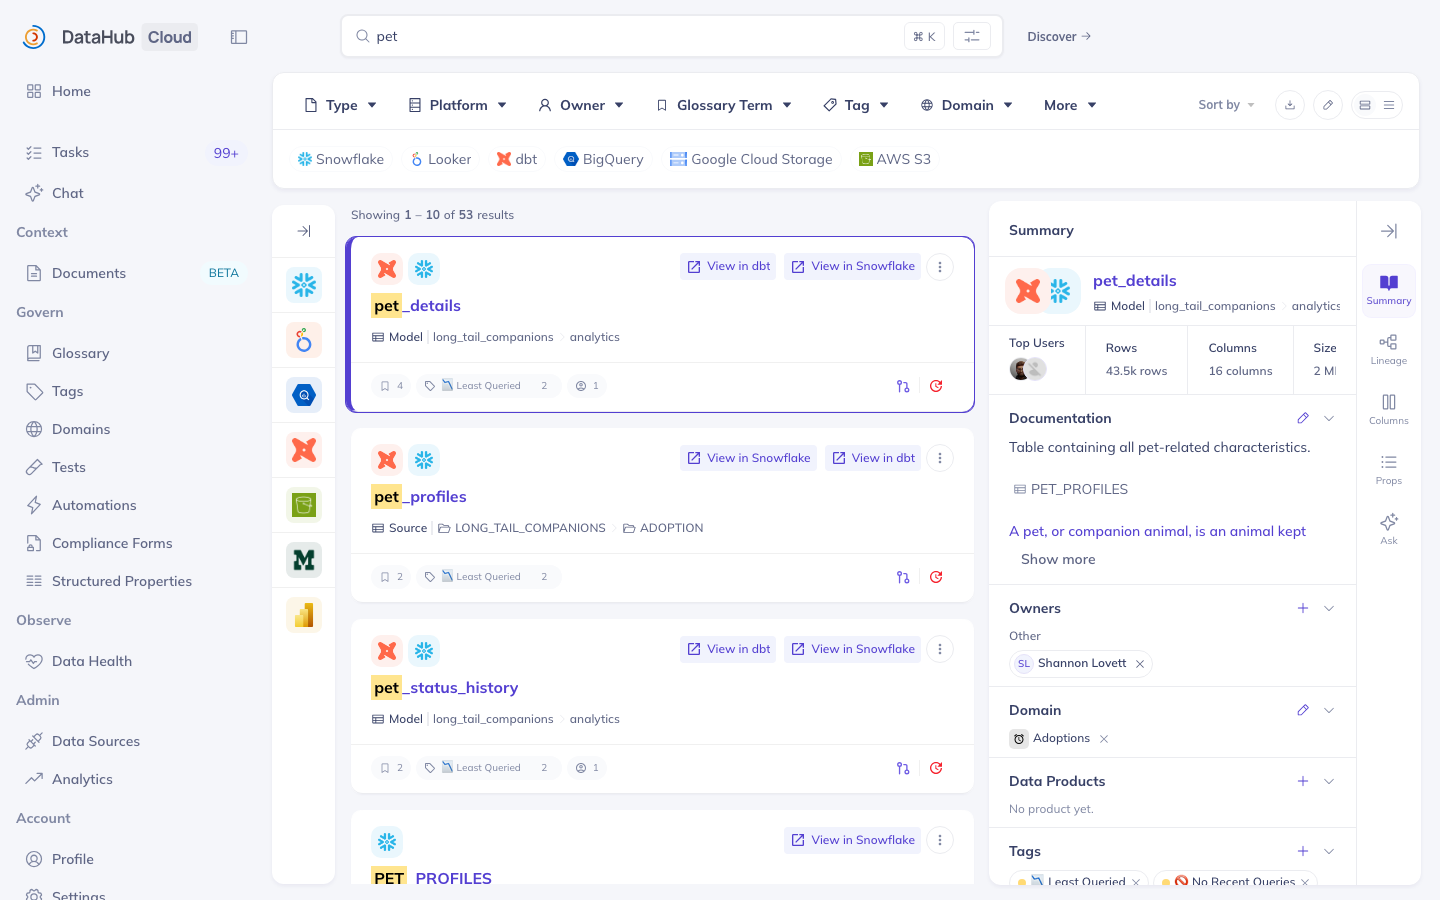
The Search Bar: Your Primary Navigation Tool
Located at the top of every page, always accessible
Searches across all entity types simultaneously (datasets, dashboards, pipelines, columns, terms, owners...)
Results page: a faceted filter bar across the top -- Type, Platform, Owner, Glossary Term, Tag, Domain
Each result shows entity name, type, platform, and tags; selecting a result opens a summary panel with its description, owner, and domain
Ranked by relevance: exact name matches are boosted to the top; the more complete an asset's metadata, the more search terms it can match on
Search is not scoped to one entity type: e.g. "revenue" can return datasets, dashboards, dbt models, and glossary terms at once -- that's a feature. Command-K on Mac, or Control-K on Windows,Cmd+K (Ctrl+K on Windows) jumps into search from anywhere.
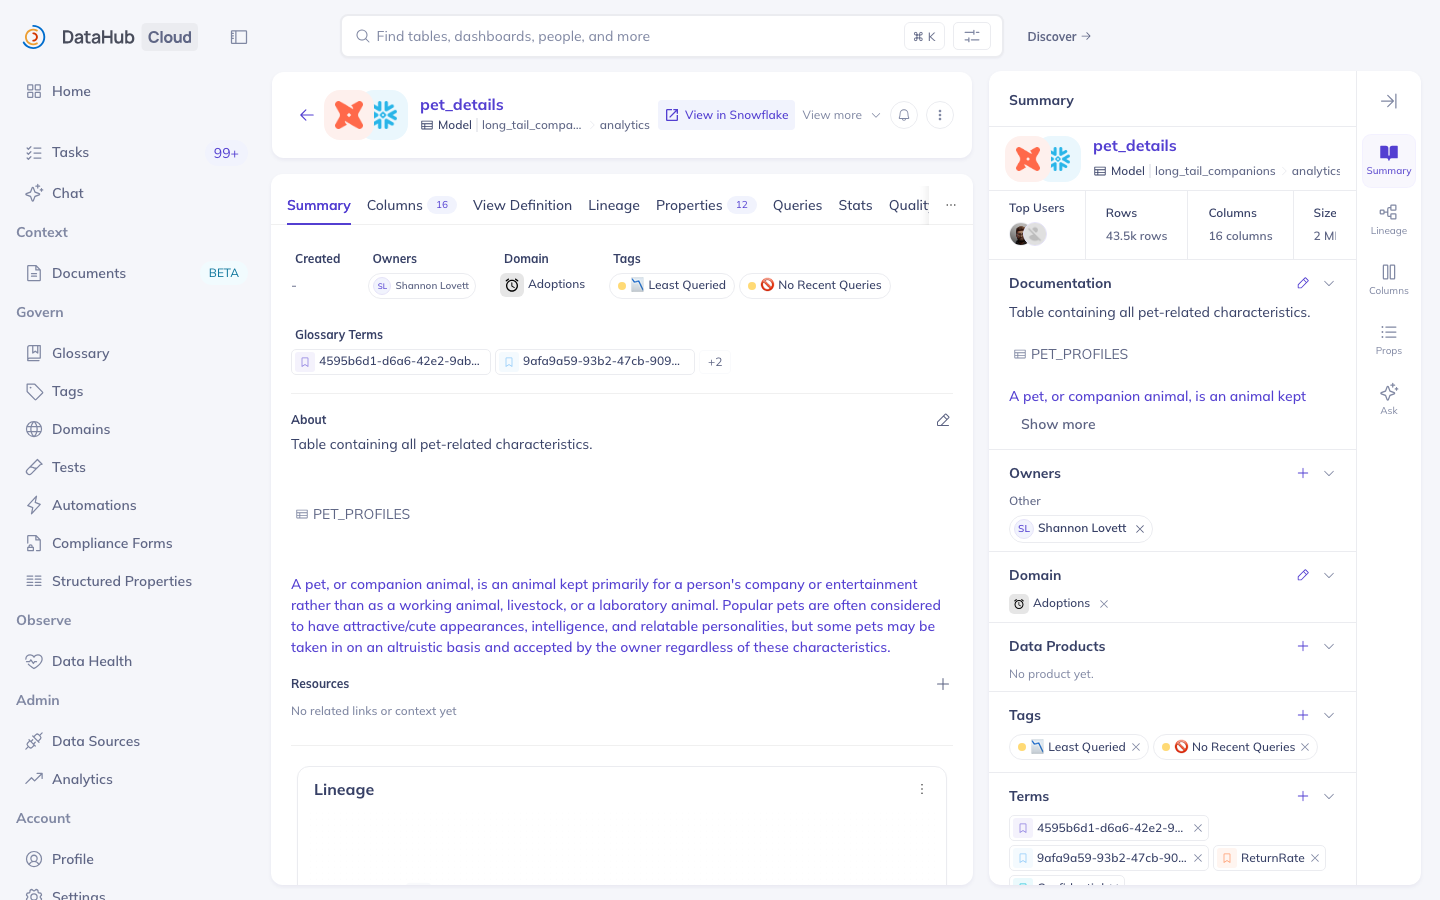
The Entity Page: Everything About One Asset
Every dataset, dashboard, pipeline, and term has one
Header: identity and status -- name, platform, deprecation status
Info panel beside the header: domain, owner, tags
Tabs: detailed metadata organized by topic
Tabs vary by entity type, but most datasets have: Summary, Columns, Lineage, Properties, Queries, Stats, Quality
Every road in DataHub leads here: search, lineage, and browsing all land on an entity page. The identity area answers "can I trust this, who owns it, where does it belong"; the tabs answer "what's inside, where did it come from, is it healthy". Tabs vary by entity type.
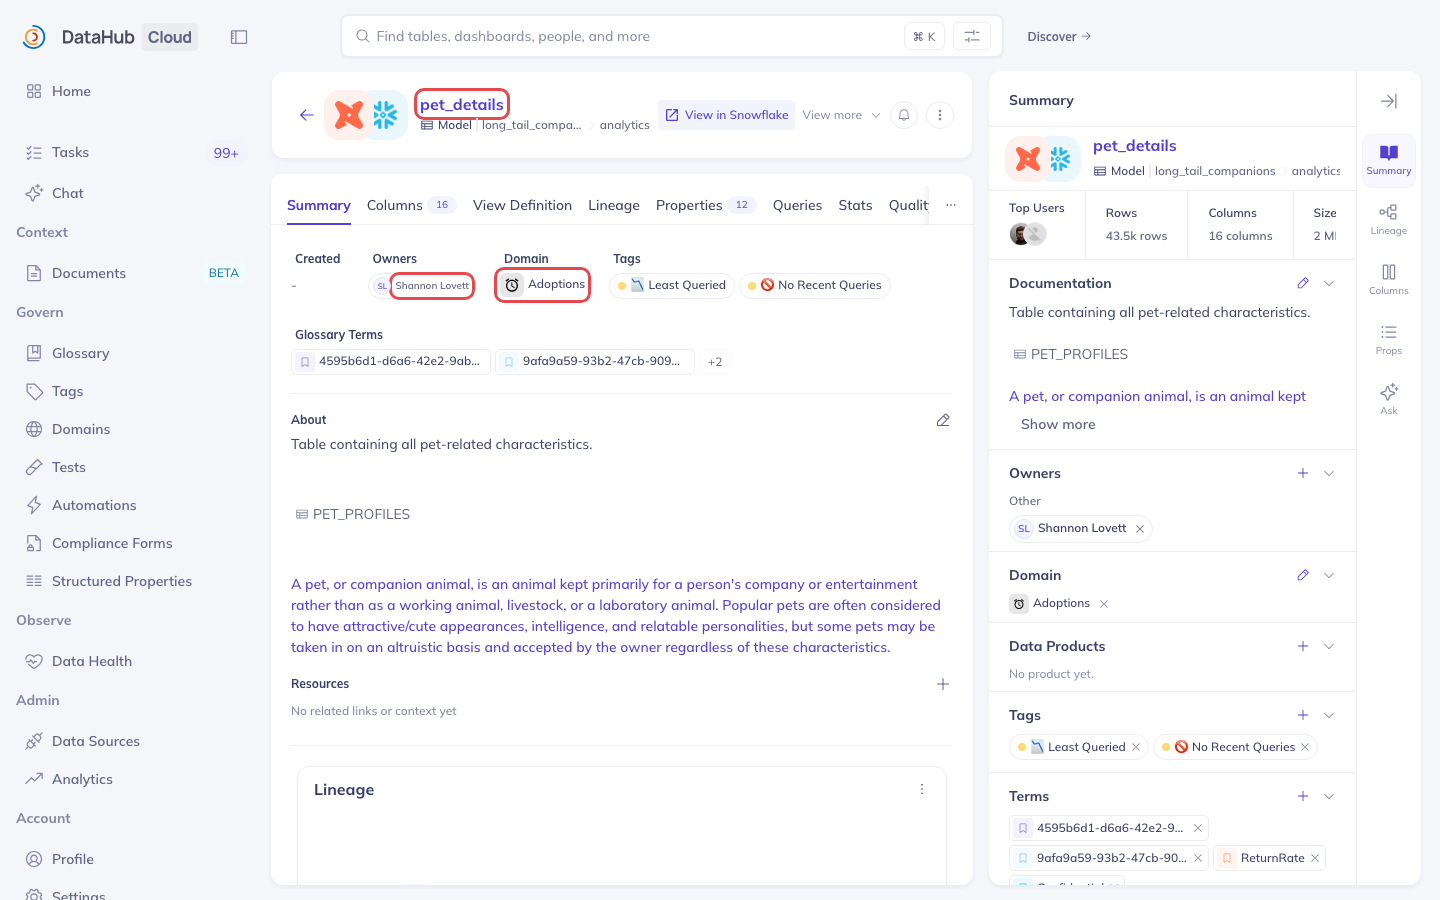
Check the Trust Signals First
Deprecated status: shown right next to the asset name -- this asset is being phased out, do not build on it
Domain: shown in the info panel beside the entity name -- tells you which business area owns this data
Owner name(s): also in that info panel -- the person or team to contact with questions
Verification note (orgs that use Compliance Forms): shows which data steward signed off and when
Rule: before reading columns, lineage, or documentation, scan these signals first
Here's the failure this prevents: someone finds a dataset, builds on it for two days, and only then discovers it was deprecated months ago. The signals sit at the top of the entity page -- read them before you read the columns.
Summary and Columns Tabs: What You See When You Open a Dataset
Summary tab: description, high-level overview, creation and ownership info
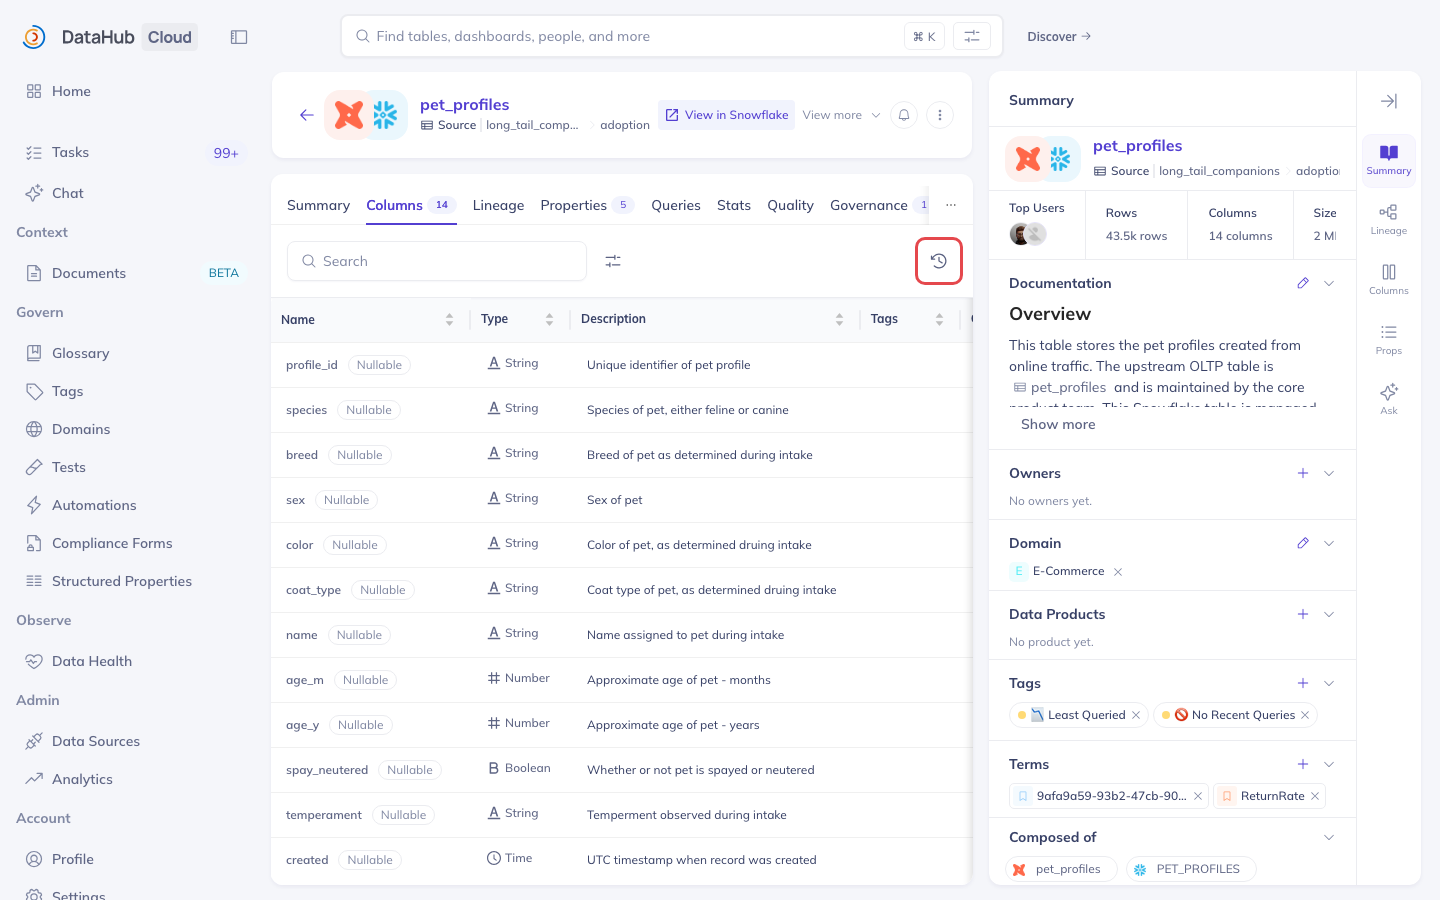
Columns tab: full column list with data types, per-column descriptions and tags
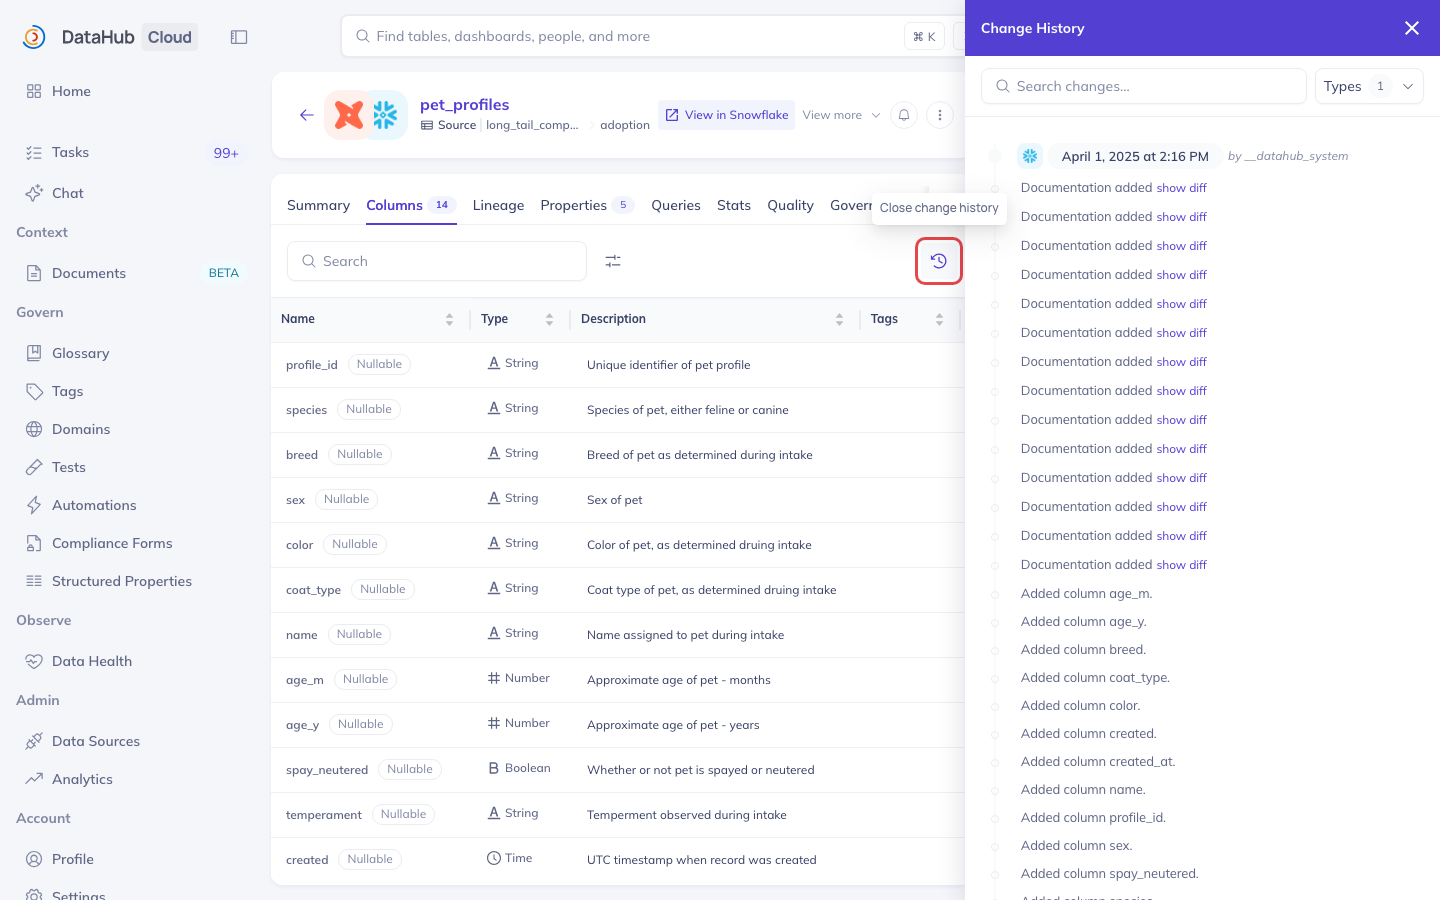
Change History (within the Columns tab): shows historical schema changes -- column additions and removals over time
Most users spend their time on the Columns tab: names, types, descriptions, and any column-level tags. The current view is a snapshot of now -- schema history lives separately, under Change History.
Historical Schema Changes Are Not in the Main Column View
The Columns tab shows the current column layout
Historical changes (columns added, renamed, or removed) are under Change History, found at the top-right of the Columns tab
Easy to miss: Change History is a toggle within the Columns tab, not a separate top-level tab
Why it matters: if a column disappeared and your pipeline broke, Change History tells you when and what changed
A column dropped last week is not in the Columns tab at all -- it's in Change History. Look for the view-change-history toggle at the top right of the Columns tab. If a pipeline breaks and you suspect a schema change, that's where you confirm it.
Lineage Tab: Tracing the Data Journey
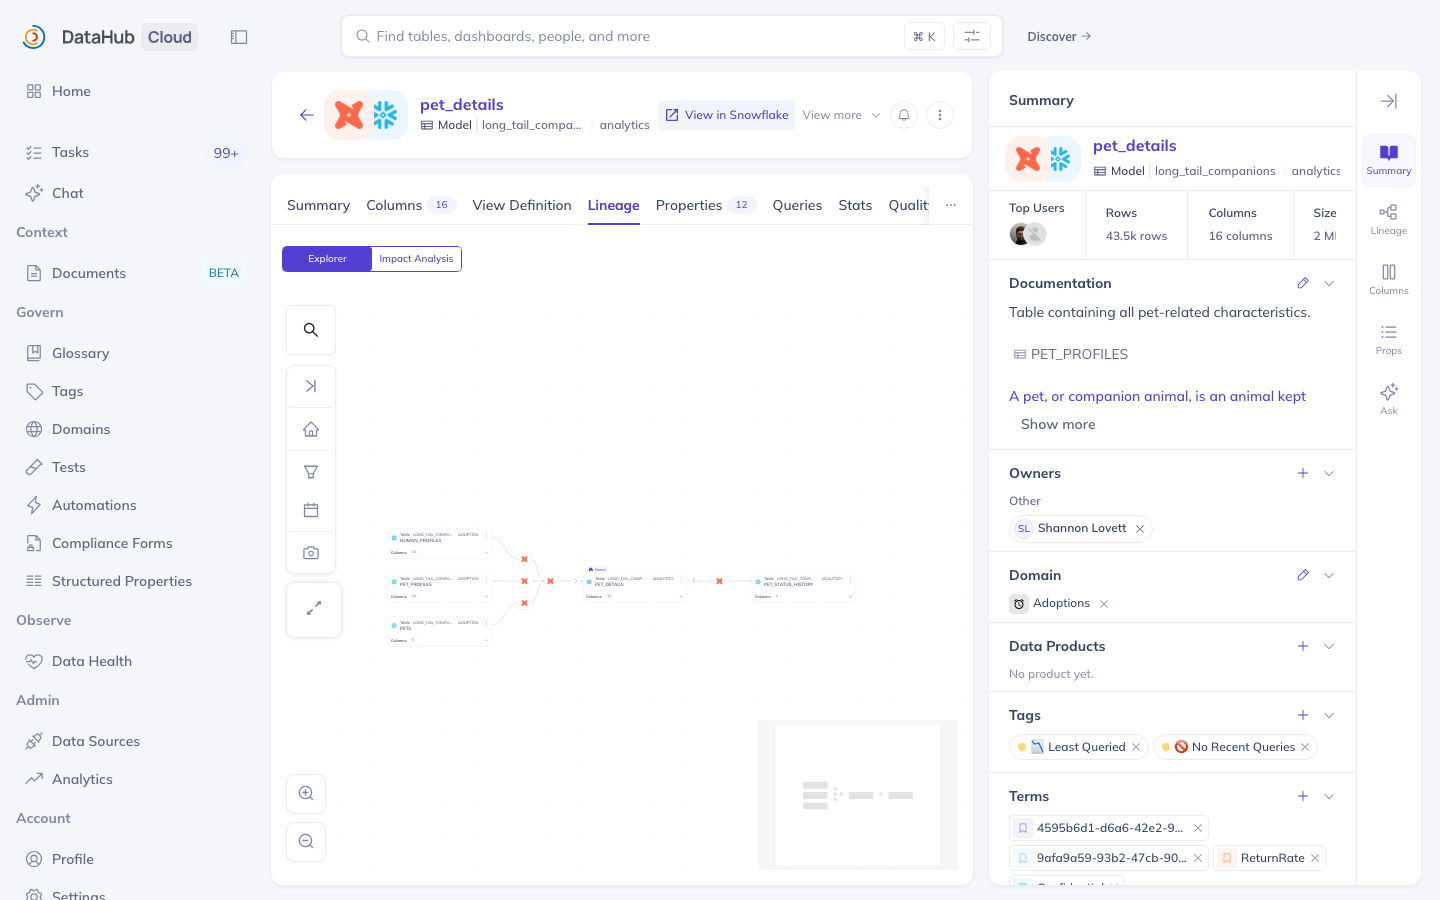
Interactive graph showing upstream and downstream assets
Upstream: where did this data come from? (source tables, dbt models, Airflow jobs that produced it)
Downstream: what uses this data? (reports, dashboards, downstream tables)
Column-level lineage: toggle to see which upstream column maps to which downstream column
Navigate the graph: click any node to open that entity page
Picture a table like finance.revenue_summary: lineage shows it was built by a dbt model from a raw Salesforce sync loaded by Fivetran. Downstream, it shows the dashboards that read from it. The whole chain is visible and clickable, so when something breaks or changes you can see the full blast radius.
Use Downstream Lineage as an Impact Analysis Tool
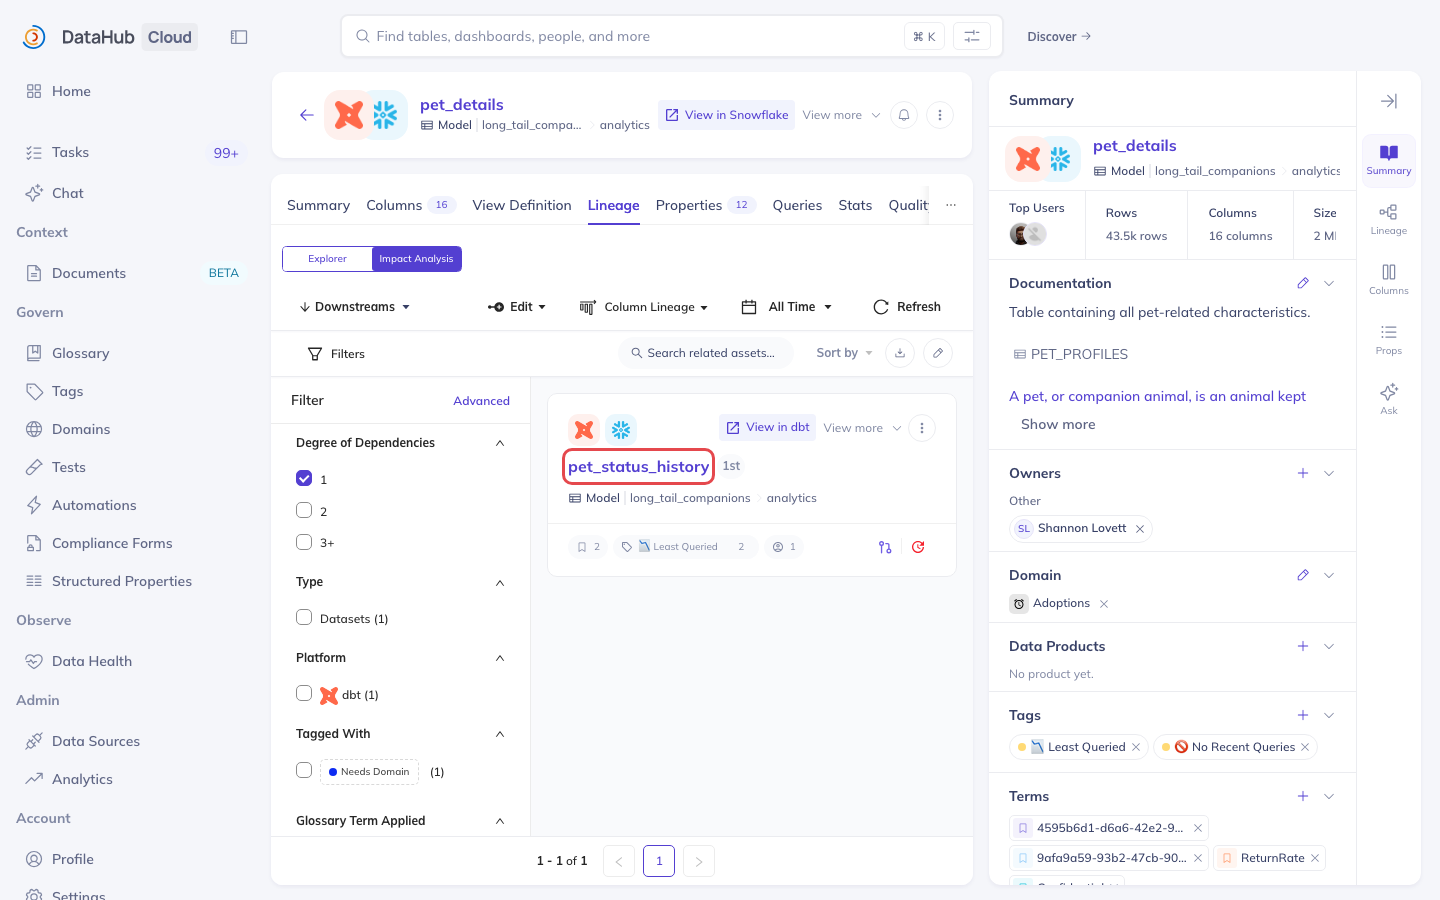
When you need to know who depends on a table before changing it, open the entity's Lineage tab and switch to the Impact Analysis view (defaults to downstream)
Covered in depth in Lineage -- this is an early preview so you can apply it during the Discovery exercises
Before renaming a column or changing a table, open the Lineage tab first: seeing eleven downstream assets before you touch anything is the difference between a planned change and a dashboard going blank two days later. Make it a habit, not a rescue.
The Remaining Tabs at a Glance
Quality: check if the dataset is fresh, passing assertions, or has recent failures
Queries: see sample queries that have referenced this asset (from query logs)
Properties: raw properties ingested directly from the source system
Documentation: rich-text documentation written by the team
If a stakeholder asks "is this data up to date?", Quality is your first stop, with assertion results and freshness checks. And when query-log ingestion is configured, the Queries tab shows how the asset is actually used in practice.
Domains and Glossary: Browsing Without Searching
Domains (left navigation, under Govern): organized by business area (Finance, Marketing, Engineering...); click a domain to see all assets assigned to it -- good for "I want to see everything in the Finance domain"
Glossary (left navigation, under Govern): browse business terms and their definitions; each term links back to all assets tagged with it
Search is for when you roughly know what you want; browsing is for orientation. New on the Finance team? Open the Finance domain -- that's your starting inventory. Heard "Monthly Active Users" in a meeting? Open the term in the Glossary and follow it to the source of truth.
Make DataHub Part of Your Daily Workflow
Bookmark the DataHub home page in your browser
Before writing a query: check if the dataset is Verified, not deprecated, and you're using the right columns
Before building a dashboard: check ownership and domain to confirm you have the right authoritative source
Before deprecating or changing an asset: run impact analysis via the Lineage tab
When something breaks: check the Columns tab's Change History and the Quality tab before filing a ticket
The barrier is almost never "I don't know how" -- it's "I didn't think to check." Treat DataHub as a pre-flight checklist before you start work, not a rescue tool after something breaks, and keep it one click away.
Summary and What's Next
Navigate DataHub from the home page, search bar, and Domains
Read an entity page's header and info panel to assess trust signals
Choose the right tab (Columns, Lineage, Quality) based on the question you're answering
Use downstream lineage to assess impact before making changes
Key rule: search bar for discovery, Domains for browsing