A dataset is one collection of data, catalogued as a single page in DataHub
When people document, discuss, or debate data, they're usually talking about a dataset
The most common kind: a relational database table (Snowflake, BigQuery, Postgres...)
Not the only kind — also database views, streams (Kafka topics), and files or folders in a data lake (S3)
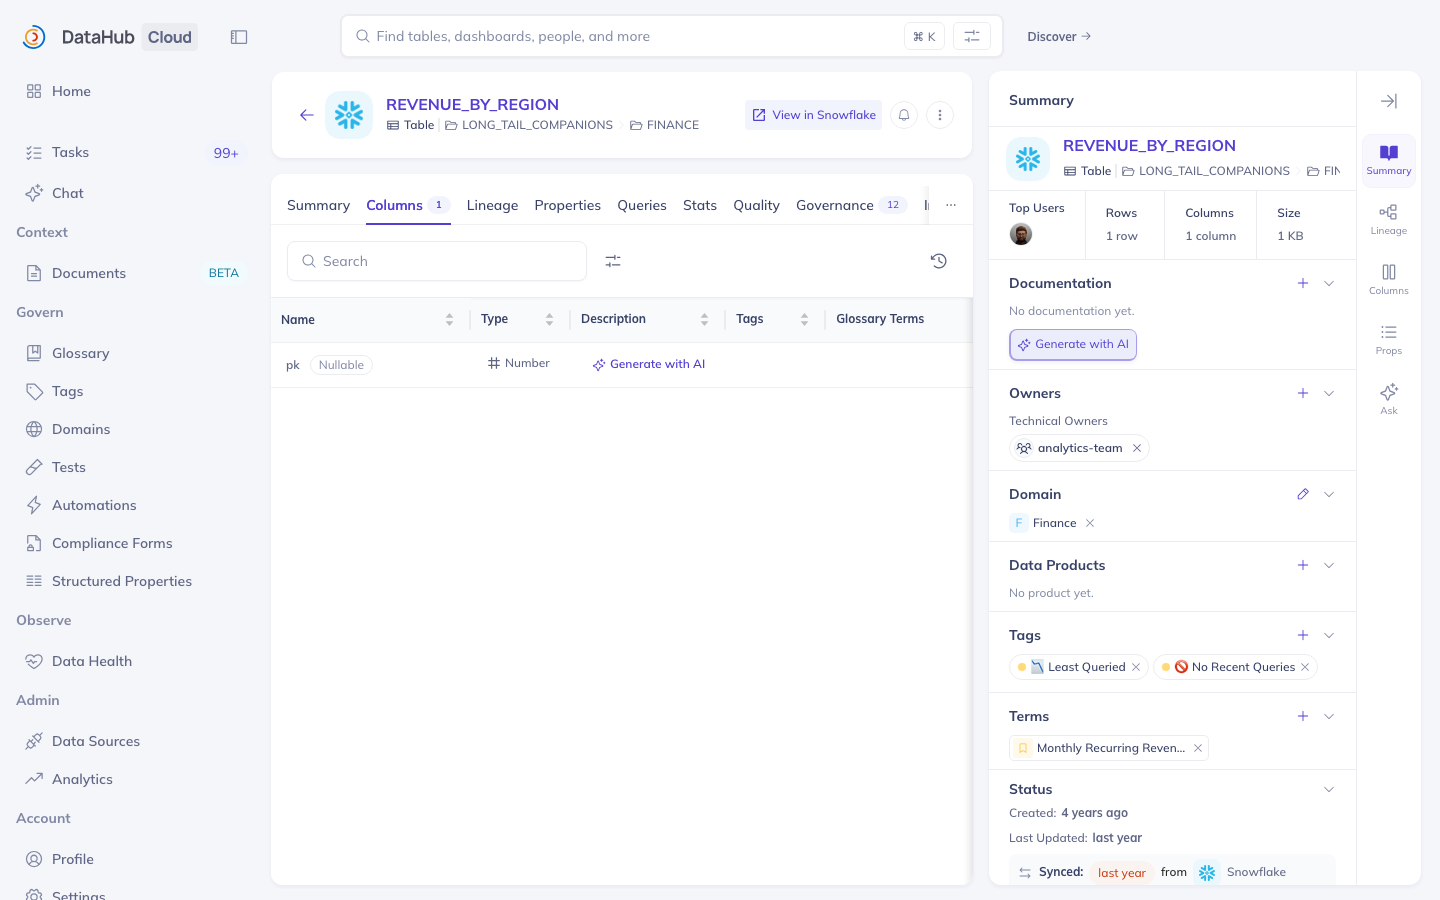
One dataset = one page: description, columns, owners, tags, and more, all in one place
Nearly every real conversation about data happens at the dataset level: is this table trustworthy, who owns it, what does this column mean? That's why datasets anchor everything else in this module. And the broad definition pays off: a view, a Kafka topic, and a folder of files in S3 all get the same kind of page, so once you can read one dataset page, you can read them all.
Datasets Contain Information About Your Data — Not Your Data
A dataset page holds information about your data: columns, descriptions, owners, tags, quality status
It does not hold the data itself — none of your rows live in DataHub
To see or query the actual data, you go to the source system: Snowflake, Kafka, S3...
Rule of thumb: DataHub answers "what is this table and can I trust it?" — your database answers "what's in it?"
A DataHub dataset is a page of context -- the rows never leave the source system. Ingestion can bring in profile statistics and sample values, but those are statistics captured as metadata, not a window into the data; querying always happens in the source system.
Columns: What's Inside a Dataset
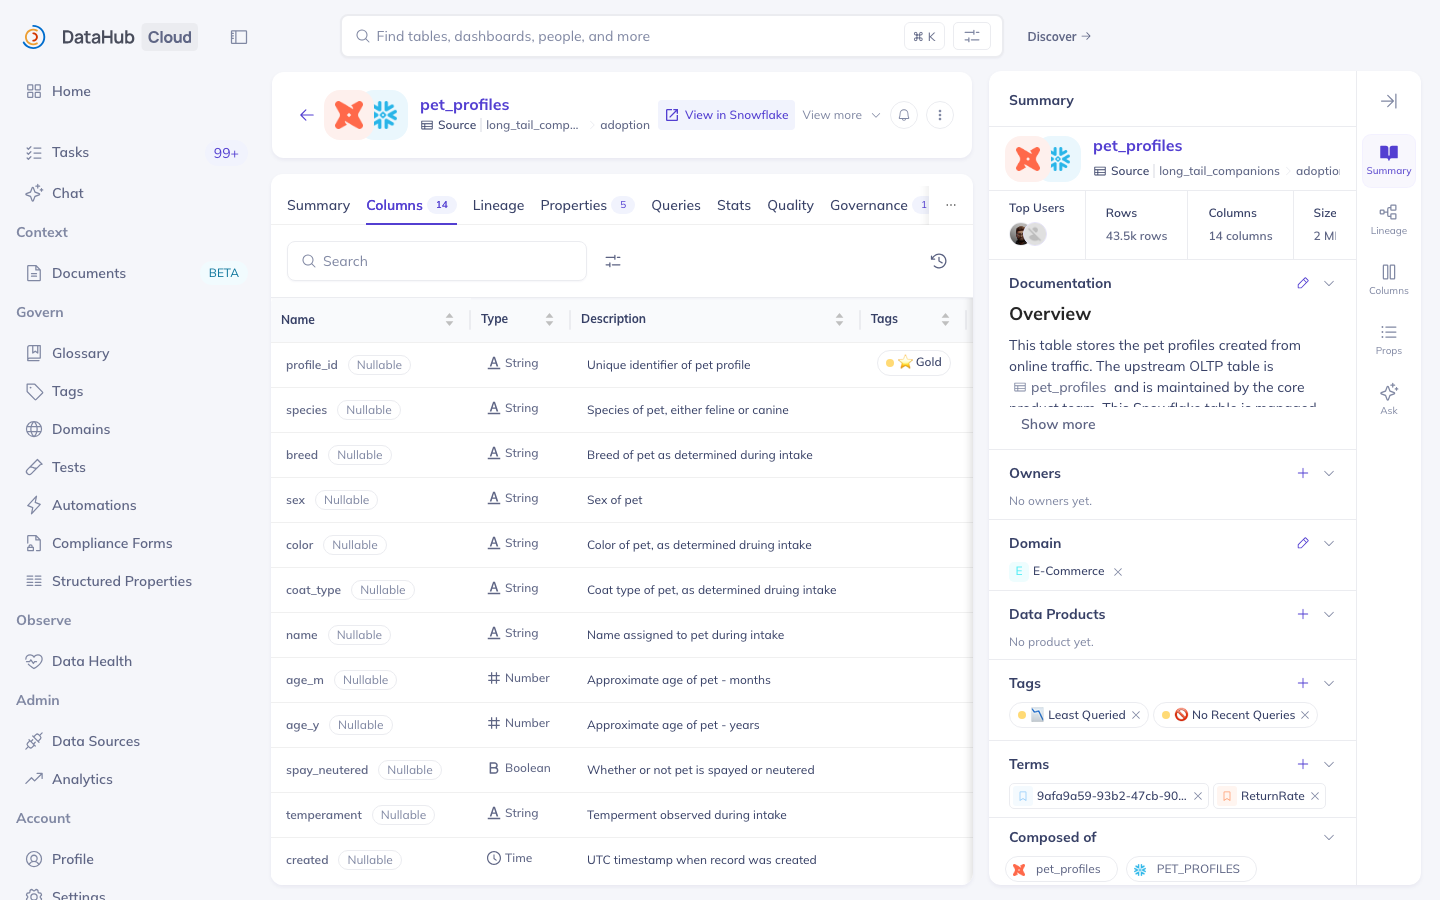
Every dataset page has a Columns tab listing each column (DataHub calls these schema fields)
For each column you see: name, data type, and description
Columns can carry their own metadata — a description, tags, and glossary terms per column
Why you care: check whether revenue_usd is what you think it is before you query it
Metadata doesn't stop at the table level: a single column can carry its own description, tags, and glossary terms -- a customer_email column tagged PII is the classic example. One naming note: the UI tab is called Columns, while older docs and APIs say schema or schema fields. They mean the same thing.
Columns Don't Contain Your Data Either
Same principle one level down: a column entry holds information about the column
Its name, data type, description, tags, and terms — not the values stored in it
The revenue_usd row on the Columns tab tells you what revenue_usd means; the numbers themselves stay in the source system
The Columns tab describes each column; it never shows the column's contents. If profiling is enabled you may see sample values and null counts. Those are statistics recorded as metadata, not live data.
Tags: Quick, Informal Labels
Tags are informal, loosely controlled labels that help search & discovery
Apply them to a whole dataset or to a single column
Examples: PII, Deprecated, Certified, NeedsReview
An asset can have many tags
Search for a tag, or filter search results by tag
Creating new tags requires the right privilege (Editors by default); applying an existing tag is an everyday steward action
Tags are the lightest-weight metadata in DataHub. Think of them as sticky notes: there's no approval workflow, no hierarchy, and no formal definition required. Applying an existing tag is open to most users, but creating a brand-new tag requires the Manage Tags privilege, held by Editors and Admins by default.
Glossary Terms: Your Official Business Vocabulary
A glossary term is a word or phrase with a specific, agreed business definition
Terms live in the Business Glossary (Govern > Glossary), organized into Term Groups — folders that can nest
Apply a term to a dataset or to a single column to say "this data means X"
Example: tagging a column with the term Email Address tells everyone it follows your org's definition of an email address
The glossary is a curated tree, where term groups act like folders and terms carry the definitions. Stewards maintain it; everyone else consumes it. The most useful trick is applying them at the column level: mark every email column in the company with one Email Address term, and finding all email data becomes a one-click search.
Tag or Glossary Term? Don't Mix Them Up
Tags: informal, made up as needed, no required definition — built for search & discovery
Glossary terms: formal, centrally curated, carry an agreed definition — built for shared meaning and governance
Rule of thumb: if it needs a definition everyone must agree on, it's a term; if it's a quick flag, it's a tag
Wrong: creating a tag called "email-address-v2-final" — that's vocabulary, use a term
The short rule: tags serve search and discovery; glossary terms standardize what an attribute means, especially at the column level. "NeedsReview" is a tag; "Quarterly Recurring Revenue" needs an agreed definition, so it's a term. There is no single right taxonomy -- the point is to choose deliberately.
Structured Properties: Your Organization's Custom Fields
Structured properties are custom, typed fields your admins define once and stewards fill in per asset
Like tags and terms, they can be set at the dataset level or on an individual column
Typed means validated: Text, Number, Date, Rich Text, or a reference to another DataHub entity — optionally restricted to a list of allowed values
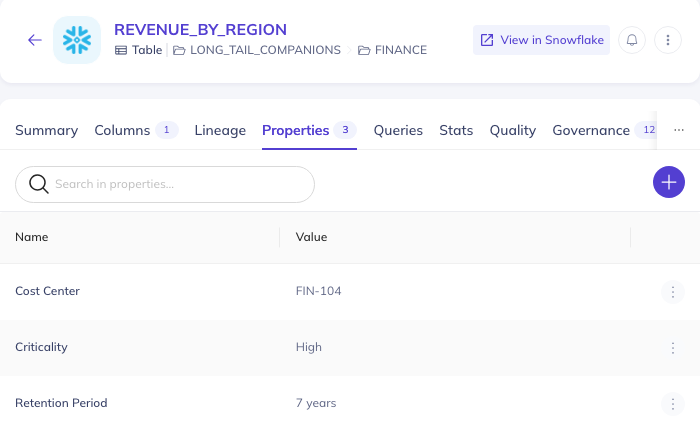
Examples: Retention Period, Cost Center, Deprecation Date, Criticality (High/Medium/Low)
Where you see them: the asset's Properties tab; admins can also surface them in the sidebar, as a badge, or as search filters
These are the fields DataHub didn't ship but your organization needs. Tags and terms label data; structured properties record facts in a controlled format -- a retention period is a number, a criticality is one of three allowed values, and DataHub validates what's entered. If your org uses them, the Properties tab is where compliance-relevant facts live.
Domains: Where an Asset Lives in the Business
Domains are curated, top-level folders that group related assets by business area
Example domains: Finance, Marketing, Engineering, Risk, Compliance, Data Science
An asset belongs to at most one domain at a time
Domains can be nested — e.g. a Marketing domain with a Campaigns sub-domain
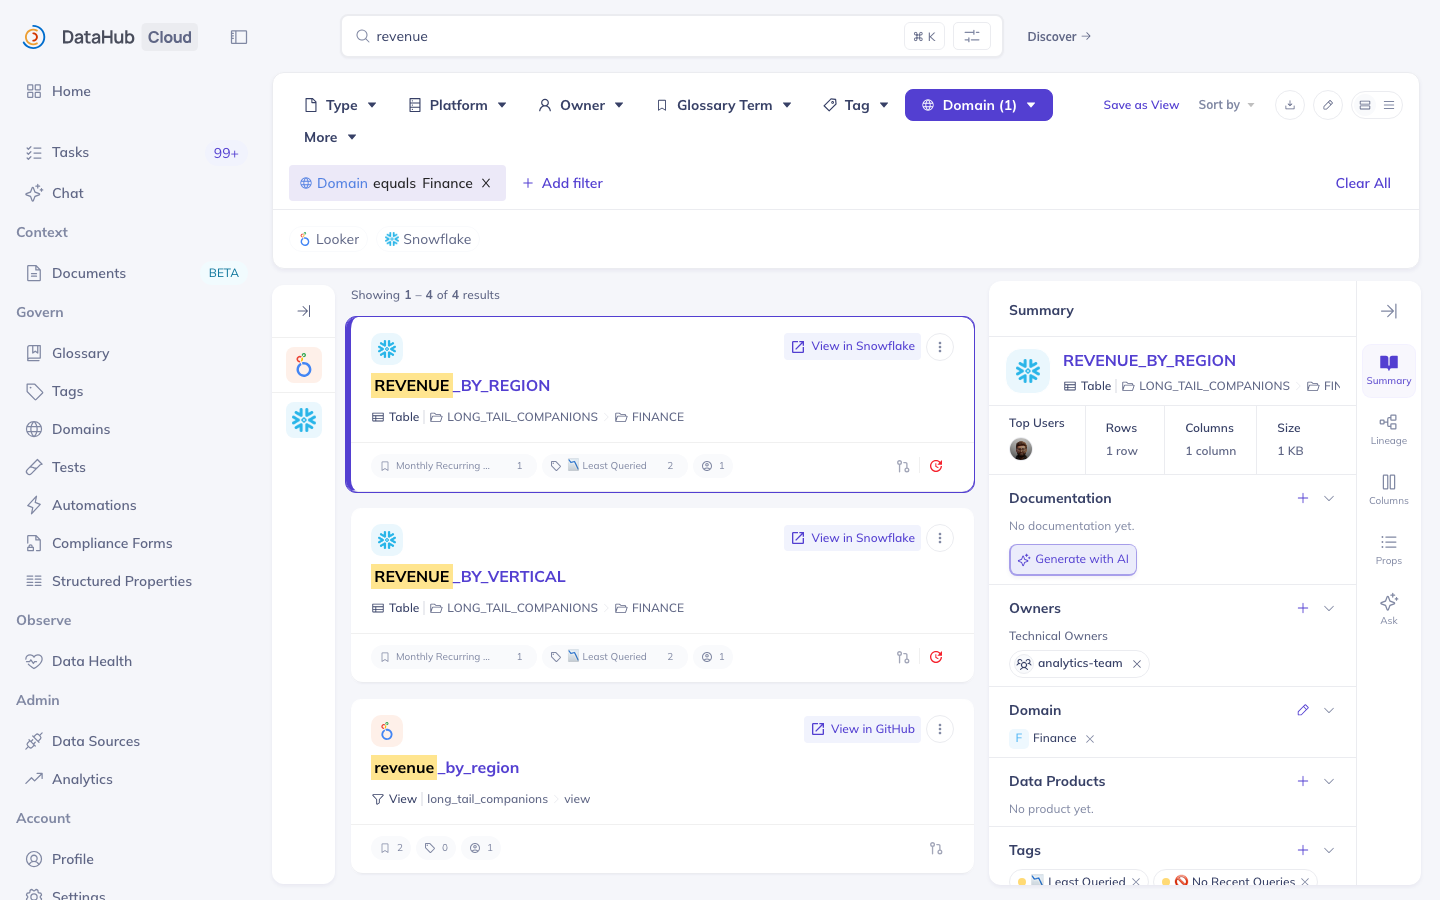
Why you care: filter any search by domain, or open a domain page to see everything that business area owns
Domains are the org chart for your data, and two rules cover most of it: an asset belongs to exactly one domain, and domains can nest. Admins set them up under Govern, then Domains.Govern > Domains. Most people simply consume them as a search filter and a browse page, and that's exactly the point.
Domains
This is what domains look like in the product — a filter in search, a browsable domain page, and a Domain section on every asset
Browsing and filtering by domain is covered in detail in Discovery
Datasets and Columns Are Entities — and They're Not Alone
In DataHub, every trackable "thing" is called an entity
Datasets and columns (schema fields) are two entity types you've already met
Other entity types include: dashboards, charts, data pipelines and their jobs, glossary terms, tags, domains, and users & groups
Every entity gets the same treatment: its own page, its own metadata, its own place in search
Everything this module covered is an entity: datasets, their columns, the domains they sit in, even the tags and glossary terms applied to them. The catalog treats them all uniformly. A Looker dashboard is an entity of type Dashboard; the Finance domain is an entity of type Domain.
Every Entity Has Exactly One Unique Name: The URN
URN stands for Uniform Resource Name — the permanent ID of one entity
A URN is unique across the entire catalog — across ALL entity types, not just within one — because the entity type is written into the URN itself
Display names can change; the URN never does
Because the entity type is part of the URN itself, two different entity types can never collide -- a URN is globally unique across the whole catalog, not just within its own type. Nobody types URNs by hand: you copy one from the UI whenever a script, API call, or ticket needs to reference an exact asset. Names are for humans and can change; the URN is the permanent handle.
DataHub Benefits for Data Users
Find data across every system from one search bar — filter by domain, tag, term, owner, or platform
Read an asset's full story on one page: description, columns, owners, tags, and quality
Trace lineage — where data came from and everything it feeds — before trusting or changing a table
Check quality at a glance: freshness, volume, and column checks with pass/fail status right on the asset
Know who's responsible — and who to ask — from the owners listed on every asset
Everything on this slidethe next slide works without ever editing anything -- it's what anyone who uses data gets from DataHub. Your learning path covers the parts most relevant to you.
DataHub Benefits for Data Publishing and Governance
Enrich assets: write descriptions, apply tags and glossary terms, claim ownership — at the dataset or column level
Record governed facts with structured properties; curate the glossary and domains
Package related assets into data products that consumers can find and trust as a unit
Automate governance: rules that flag undocumented high-usage tables, forms that collect sign-offs, and metadata that propagates on its own
Go programmatic: everything the UI shows is available through APIs, and even internal, homegrown tools can publish into the catalog
Everything hereon the next slide changes the catalog, and in most organizations it belongs to publishers, stewards, governance teams, and developers. You may never do any of it yourself -- the goal is to recognize these capabilities and know who to ask.
How Metadata Gets Here: Ingestion and Enrichment
Ingestion — what systems know
Driven by connectors (built-in or custom) and API calls, on a schedule or on demand.
Populates the URN, structured fields (the schema), lineage, and platform facts.
Whatever ingestion owns, it overwrites on every run — hand edits to those fields don't survive.
Enrichment — what people know
Driven by the UI, the API, and agents.
Populates descriptions, tags, glossary terms, owners, domains, and structured properties.
These fields belong to enrichment — ingestion runs leave them alone.
The core rule: every field has one owner. Ingestion owns the technical layer, meaning the URN, the schema, and lineage, and it overwrites that layer on every run, so hand edits there don't survive. Enrichment owns the human layer, meaning descriptions, tags, terms, owners, domains, and structured properties, and ingestion runs leave those fields alone. Watch the naming trap: structured fields, as in schema, are ingestion-side, while structured properties are enrichment-side.
How This Looks Day to Day
Connectors ingest data sources like Snowflake, BigQuery, Kafka, S3, and Looker on schedule — DataHub ships 80+ connectors — so tens of thousands of assets stay current with schemas and lineage, no manual cataloguing
Stewards and analysts enrich through the UI and agents — descriptions, PII tags, and glossary terms on the assets that matter most
Engineering teams build their own middleware and DataHub Actions pipelines that write to the same API — managing classification labels programmatically, at a scale no one could hand-tag
As a user you mostly consume all of this — and the moment you propose or directly edit a description, tag, or term, you're contributing on the enrichment track
This is the environment you're walking into: connectors keep the technical layer current on a schedule, stewards and analysts enrich what matters through the UI, and classification at scale runs as engineering-built automation. All three happen at the same time, and none of them replaces the others.
Read a Dataset Page End to End
Your task (5 minutes):
Search for any dataset in the shared DataHub instance and open it
Find its domain in the left sidebar
Open the Columns tab and pick one column: note its type and description
Find at least one tag or glossary term (dataset-level or column-level)
Open the Properties tab and note any structured properties filled in
Summary: The Everyday Concepts
Dataset: a table (most often), view, stream, or file, catalogued as one page — where most reasoning about data happens
Columns: the fields inside a dataset, each with its own type, description, and metadata
Tags, glossary terms, and structured properties: set at the dataset level or on individual columns
Domain: the one business area an asset belongs to — filter and browse by it
Datasets, columns, domains, terms... are all entities, and every entity has exactly one URN — unique across the whole catalog